1998-1999 Annual Report


Inyo County Water Department’s Annual Report on Activities and Conditions in the Owens Valley 1998
Perspective
Greg James, Director
With the settlement, in mid-1997, of litigation over the 1991 environmental impact report for groundwater management in the Owens Valley, 1998 was the first full year of implementation of the Inyo/Los Angeles water agreement. Carrying out the work in the EIR, the agreement, and an associated Memorandum of Understanding kept the Inyo County Water Department’s staff busy throughout the year. To ensure that all of these responsibilities will be met in the coming years, a reorganization of the department was approved by the Board of Supervisors.
Plans for the revegetation of approximately 1,300 acres identified for mitigation in the EIR were developed in large measure due to the efforts our new Revegetation Project Coordinator, Irene Yamashita. Under the tutelage of our new Saltcedar Project Coordinator, Brian Cashore, crews were recruited, materials purchased, and the first major dent was made in the population of saltcedar in the Owens Valley.
Planning for the rewatering of the Lower Owens River moved ahead aided by the capable work of Environmental Project Coordinator, Leah Kirk. (It is now planned that the environmental review of the project will be completed in 2000, and that water will flow in the 60-mile channel by as early as 2001.) The department was immensely aided by the expansion of our Geographic Information System under our new GIS manager, Chris Howard. County Hydrologist, Randy Jackson, with much able help from our new hydrologist, Bob Harrington, greatly advanced our ability to predict water table fluctuations due to groundwater pumping. Our science program has improved with the promotion of Aaron Steinwand to Science Coordinator.
With the invaluable assistance of Inyo County’s Congressman, Jerry Lewis, the county obtained an additional $3 million in federal funds for the Lower Owens River Project. These funds, when combined with the $550,000 in federal funds already obtained through the Congressman’s hard work, reduced the county’s $3.75 million obligation for the project to $200,000. With the help of Congressman Lewis, this remaining obligation may be offset by additional federal funds obtained during 1999.
With regard to groundwater pumping by the City of Los Angeles, under the Drought Recovery Policy adopted by the city and the county during the prolonged drought from 1987 to 1992, groundwater pumping in 1998-99 was again kept low (51,575 acre-feet) in order to promote water table recovery from the declines experienced during the drought. Under this policy, water tables have recovered to pre-drought levels in many areas of the valley, and are expected to rise in the other areas of the valley with the continuation of conservative management in 1999-2000.
Intensive vegetation monitoring throughout the drought period, conducted under the watchful eye of Vegetation Scientist, Sally Manning, documented that vegetation conditions in most of Los Angeles’ wellfields, declined below the vegetation baseline conditions set by the agreement. However, the monitoring has shown conditions improving to equal or greater than baseline conditions with the recovery of water tables combined with the return of average or above precipitation. Similar vegetation recovery is expected in the other areas as water tables return to pre-drought levels.
Despite the demonstrated resiliency of the valley’s groundwater dependent vegetation, uncertainty remains as to the ability of the vegetation to repeatedly rebound if future groundwater pumping causes significant fluctuations in water tables. Consequently, in June 1998, the Inyo/Los Angeles Standing Committee agreed to conduct cooperative studies that could affect future groundwater management. The Standing Committee also agreed that, while the cooperative studies are being conducted over a 3 to 5 year period, groundwater pumping will continue to be managed in an environmentally conservative manner. The Inyo/Los Angeles Technical Group is expected to present its recommendations for the cooperative studies and for a conservative groundwater management policy to the Standing Committee in 1999.
In early 1998, Los Angeles proposed expanding its groundwater pumping beyond the Owens Valley floor to Owens Lake. Early in the year, Los Angeles announced that it planned to investigate the feasibility of pumping groundwater from Owens Lake to supply water to its dust abatement program on the lake. Any groundwater pumping by Los Angeles from anywhere in Inyo County is regulated by the agreement. Since Los Angeles has never previously pumped from the lake, a cooperative study was commenced to determine whether groundwater may be safely pumped from under the lake in both the short-term and the long-term.
The county and the city, through the consultant Camp, Dresser & McKee, commenced a workshop process to document the public’s concerns regarding the proposed pumping from the lake. The concerns expressed by the public will be used by the county and the city in setting the environmental controls that will govern any pumping from the lake.
Concerns over groundwater pumping were not limited to actual or proposed pumping by Los Angeles during 1998. A private corporation, the Western Water Company, announced its intention to purchase property and/or water rights in the Olancha area. The company wants to pump groundwater and sell it to Los Angeles. Faced with this new situation, in early 1998, the county and Los Angeles agreed that the city would not purchase water extracted or diverted from Inyo County unless the county is satisfied that the purchase will not harm the economy or environment of the county.
In the fall of 1998, the county adopted a comprehensive groundwater management ordinance that regulates water export projects, such as the project proposed by the Western Water, through a conditional use permit process. Under the ordinance, a project may not proceed unless the county finds it will not harm the environment or economy of the county.
Although much was accomplished in 1998, many challenges remain. Cooperative studies to improve groundwater management must be identified, agreed upon, and conducted by the county and Los Angeles. A conservative groundwater management policy remains to be agreed upon by the Standing Committee. The environmental “rules” that will govern any groundwater pumping from Owens Lake must be established by the Standing Committee, and it must be determined whether any pumping can take place under the “rules.” Western Water’s proposed groundwater export project must be evaluated by the Water Department, and decisions must be made by the Inyo County Planning Commission as to whether or not a permit to allow the project to proceed should be issued. The environmental review process for the Lower Owens River Project must be completed before the project can be implemented. These activities and more (and perhaps others yet to be determined) will keep the folks at the Water Department busy in 1999 and during the coming years.
Owens Valley Water Management
Inyo County and Los Angeles agreed to a maximum groundwater pumping limit of 64,000 acre-feet for the 1998-1999 runoff year (April 1, 1998-March 31, 1999). An additional amount of groundwater could be pumped by the Los Angeles Department of Water and Power during the winter, if necessary, to prevent the water in the Los Angeles Aqueduct from freezing. Actual pumping was 51,575 acre-feet. The pumping limit was based on predictions of water table responses at 18 indicator wells and in consideration of valleywide vegetation conditions.
Water uses on LADWP’s Owens Valley lands for the runoff year were planned at about 92,860 acre-feet. These uses included 44,900 acre-feet for irrigation, 16,800 acre-feet for stockwater, 8,730 acre-feet for LADWP recreation and wildlife projects, and 22,430 acre-feet for enhancement/mitigation projects, including Klondike Lake, Lone Pine Riparian Park, treelots in Independence and Lone Pine, several native pastures and alfalfa fields, and the Lower Owens River rewatering project.
LADWP’s April 27, 1998 snow survey reported water content in the Mammoth Pass snowpack as 64.1 inches. The 1998 snowpack varied throughout the Eastern Sierra from 163% of normal at Mammoth Pass to 119% of normal at Rock Creek. Measurements at LADWP’s snow survey stations at Big Pine Creek and Cottonwood Lakes were 164% and 183%, respectively.
Runoff in the Owens Valley for April 1998-March 1999 was projected by LADWP at about 603,800 acre-feet or 152% of normal. Recharge to the valley’s aquifers for the 1998 water year (October 1, 1997September 30, 1998) was estimated to be 233,131 acre-feet.
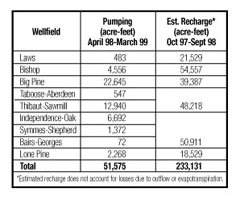
Table 1. Owens Valley Groundwater Pumping (Runoff Year 1998-1999) and Estimated Recharge (Water Year 1998) by Wellfield.
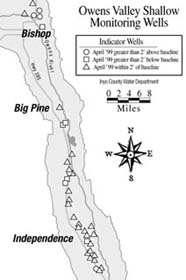
Figure 1. Water levels as of April 1999 in selected shallow monitoring wells relative to baseline groundwater conditions.
Groundwater Conditions
Robert Harrington, Assistant Hydrologist
Leah Kirk, Environmental Project Coordinator
During the course of each year, groundwater levels are measured at about 700 monitoring wells throughout the Owens Valley. Depending on their location, monitoring wells are checked annually or monthly. At a few sites, ICWD and LADWP have installed continuous monitoring devices.
These data are used each year to predict water level changes at selected indicator wells throughout the valley. Multiple linear regression equations developed for these monitoring wells allow ICWD and LADWP to predict the water table response to different groundwater pumping scenarios (see “Predicting Water Table Response to Groundwater Pumping” on page 16).
Under the conservative groundwater management of the Drought Recovery Policy, LADWP’s pumping has been relatively low since 1990 and water tables have gradually climbed. In general, water tables continued their upward trend during 1998, due to high recharge and low pumping. Figure 1 shows that as of April 1999, water tables were approaching baseline levels over much of the valley. “Baseline” is the average April water-level from 1985-1987.
Soil Water Conditions
Aaron Steinwand, Soil Scientist Science Coordinator
Each month, the Inyo County Water Department’s Derik Olsen and I visit 33 monitoring sites to measure the depth to groundwater and soil water content. The measurements are used to determine whether nearby Los Angeles Department of Water and Power wells can be pumped. This determination includes several factors besides soil water content (precipitation, for example) that may allow a site to be in “on” status even though the water table is not reaching the root zone.
We know that the Owens Valley plant communities that we monitor require periodic connection to the water table for long-term survival and recovery from drought. Through our monthly monitoring, we can easily detect the rise of water above the water table due to capillarity. The soil water and groundwater data show us which monitoring sites have plant root zones connected with the water table and which still need water table recovery. From these observations we can suggest possible reasons for vegetation conditions observed at a particular site and suggest appropriate pumping management.
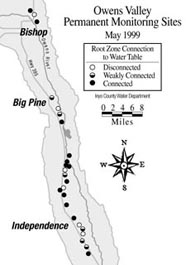
Figure 2. Owens Valley permanent monitoring sites For simplicity, the wellfield monitoring sites are grouped into three categories to summarize the root zone/water table connection. The connection between the root zone and groundwater is not only related to water table depth. It also depends on the rooting depth of the vegetation and the soil characteristics. For example, in similar soils, a shallower water table is necessary to supply groundwater to grass-dominated sites than shrub-dominated sites because of the shallower roots of the grasses. Similarly, the capillary rise above the water table in a silty soil is much greater than in a sandy soil, allowing plants access to groundwater from greater depths. Brief descriptions of the three categories of root zone/groundwater connection are given below.
For management purposes, grass-dominated sites are assigned a root zone of 2 meters; shrub sites are assigned a 4-meter root zone.
- Disconnected: No groundwater is reaching the root zone. Six of the 33 monitoring sites occur in this category. Seven sites were disconnected last year.
- Weakly connected: Groundwater reaches the bottom 0.5 meters of the root zone. Six monitoring sites occur in this category. Nine sites were weakly connected last year.
- Connected: Groundwater extends to the middle of the root zone. Thirteen sites occur in this category. Nine sites were connected last year. All eight control sites located away from the effects of pumping also occur in this category.Relatively low pumping since 1990 and several high runoff years have promoted substantial water table and soil water recovery from the declines induced by heavy pumping at the onset of the 1987-1992 drought. As of April 1, 1999, the water table was supplying water to the root zone at 19 of the 25 monitoring sites located in wellfields (Figure 2). This compares to about six sites with groundwater in the root zone near the end of the drought in 1992. A few sites, particularly in Laws, Big Pine, and south of Independence, still need additional water table recovery to supply groundwater to the root zone. These areas experienced large water table declines due to pumping and thus had the farthest to recover. The water tables in areas outside the wellfields were not affected by pumping. The root zones at monitoring sites in these areas remained connected to the water table throughout the drought.
Vegetation Conditions
Sally Manning, Vegetation Scientist
This issue of the Monitor provides a timely opportunity to discuss what has been observed, measured, and learned about the Owens Valley vegetation. Since the vegetation was inventoried and mapped in the mid-1980s, the Owens Valley environment has progressed through a full cycle, from a wet period, to drought, and back to a wet period. This cycle has allowed the Inyo County Water Department scientists to assess a wide range of vegetation responses to conditions imposed not only by the weather, but also due to pumping during this period. Results will be summarized in general terms; details of the data can be found in the reports listed at the end of this issue.
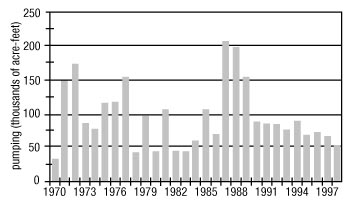
Figure 3. Annual LADWP pumping 1970-1998.
Water tables were generally high throughout the valley when the Los Angeles Department of Water and Power performed the baseline vegetation inventory during the mid-1980s. Vegetation conditions during that period were therefore the result of a series of wet years (1982-86) and sufficient water provided from groundwater. Other factors influencing the baseline vegetation conditions included site substrate properties (for example soil type), relatively recent land use history, and effects of herbivores (organisms that feed on plants).
As the inventory was being completed in 1987, there was a dry year and LADWP pumped nearly 210,000 acre-feet. The following year, 1988, was also dry, and pumping again exceeded 200,000 acre-feet (Figure 3). In the fall of 1989, Inyo County and Los Angeles began to apply newly developed groundwater management techniques at then-existing permanent monitoring sites. Because several of the monitoring sites were in soil water deficit at that time, pumping was reduced to 155,000 acre-feet. The heavy pumping during these years, combined with the drought period that lasted well into the 1990s, drove the water tables to significant depths in the wellfield areas. In most of the wellfields, water tables were substantially below baseline levels and plant root zones by 1991.
Because of the drought, LADWP and Inyo County adopted a Drought Recovery Policy. The policy recommended that water tables, soil moisture, and vegetation be allowed to recover. As a result, from 1990 through 1998, annual groundwater pumping ranged between 50,000 and 90,000 acre-feet (Figure 3).
Precipitation in 1993 was above normal, and from 1995 onward, the drought gave way to a series of wet years. Water tables responded to the reduced pumping and increased recharge by rising. By 1998, water tables had returned to baseline (mid-1980s) levels in portions of some wellfield areas. However, although water tables had risen regionally, they remained below baseline levels in large portions of most wellfields.
Patterns of Water Table and Vegetation Response
Since 1991, ICWD has re-inventoried a subset of Owens Valley vegetation parcels in an effort to detect changes in perennial cover and species composition. A vegetation parcel is a unit of land mapped as homogeneous vegetation during the LADWP baseline inventory. The parcels were selected to provide information on vegetation conditions within wellfields and at locations far from the effects of pumping (control areas). Results of each annual inventory were compared with LADWP baseline vegetation conditions.
Before analyzing the vegetation data set for a given year, the best available information on depth to the water table (DTW) is assembled. Methods for assessing the water table conditions beneath a given unit of land area have improved since employing Geographic Information System (GIS) techniques (see past issues of the Monitor). Using data from over 150 test wells located throughout the valley, a spatial statistics routine is run to develop an estimation of the water table depth for all areas being monitored. With this technique, the average DTW beneath a selected vegetation parcel in April of any year from 1985 onward can be estimated. Graphing the estimated DTW during the past 14 years shows a picture of water table fluctuation beneath the parcel, and adding the vegetation data to the same graph allows certain trends in vegetation to be compared with water table conditions.
Three general patterns of water table change and vegetation response were observed in the re-inventory data as of 1998. These patterns were assigned to the categories shown in Table 2.
Examples of DTW and vegetation data for each of these categories appear in Figure 4. Five 1998 re-inventoried parcels did not fit neatly into any of the above categories. I have recommended that more investigation of the hydrologic data associated with the latter parcels take place.
| Control | water table beneath parcel has remained relatively constant and was not found to have been affected by groundwater pumping during the drought (see Figure 4A for example) |
| Wellfield | water table was drawn down due to pumping during the drought and in April 1998 had not risen to the range where it had been during baseline years OR water table had returned to baseline range, but perennial cover was determined to be below baseline level (see Figure 4B) |
| Recovered Wellfield |
water table was drawn down due to pumping during the drought, then had recovered by 1998 or before and has been maintained in the range where it was during baseline years and perennial cover reached baseline levels (see Figure 4C) |
| Table 2. General categories of water table and vegetation response, 1985 through 1998, for Owens Valley vegetation parcels inventoried in 1998. | |
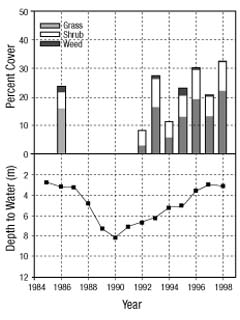
Figure 4. Examples of water table changes, 1985-98, and measured vegetation cover in the years for which field data were collected. (A) A control parcel. Depth to water varied negligibly during and after the drought (1987-92). Vegetation remained very similar to baseline during the drought period but has increased in more recent wet years (1995-98). (B) A wellfield parcel. The water table beneath this parcel was drawn down due to pumping during the drought. Vegetation cover declined below baseline. Neither water table nor vegetation had recovered to baseline levels in this parcel. (C) A recovered wellfield parcel. The water table beneath this parcel was drawn down due to pumping during the drought, but began rising and returned to baseline level. Vegetation cover declined below baseline during the drought, but has since returned to baseline levels.
Figure 4b. Laws 85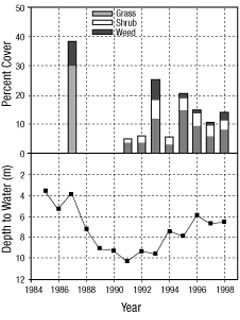
Figure 4a. Big Pine 31
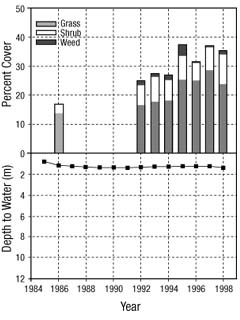
Figure 4c. Blackrock 39
Vegetation Conditions continued from previous page
The general responses of perennial plant cover to water table changes during and after the drought have been as follows:
Control – During the drought, perennial cover remained generally equal to baseline for parcels in this group. Since 1995, cover in the control parcels has increased significantly above baseline levels (Figure 5) and in 1998 it averaged 11% above baseline (Table 3). It is expected that a dry year, like 1999, would bring about a drop in cover, but it is not likely that perennial cover in these parcels would decline below baseline levels.
Wellfield – Perennial cover in the pumped areas declined significantly below baseline levels during the drought years. Although this group’s post-drought cover responses have been variable, during the two wettest years, 1995 and 1998, the group showed no statistically significant difference from baseline levels (Figure 5). The data strongly suggest that, without the presence of the water table in the plant root zones in these parcels, a subsequent dry year would result in a decline in average perennial cover to below baseline levels.
| CONTROL (31 parcels) |
WELLFIELD (33 parcels) |
RECOVERED WELLFIELD (14 parcels) |
||||
| DWP baseline |
Inyo 1998 |
DWP baseline |
Inyo 1998 |
DWP baseline |
Inyo 1998 |
|
| perennial cover | 25.63 | 36.81 | 26.69 | 24.40 | 33.80 | 41.91* |
| grass | 15.55 | 19.47 | 12.88 | 8.82* | 19.07 | 24.52* |
| shrub | 9.45 | 13.36* | 13.16 | 14.13 | 11.40 | 15.67* |
| weed | 0.68 | 3.21* | 3.78 | 11.79* | 2.24 | 6.67* |
Table 3. Some results of monitoring for vegetation changes between LADWP baseline years (1984-87) and 1998 (as measured by ICWD). Asterisks denote statistically significant changes in that category.
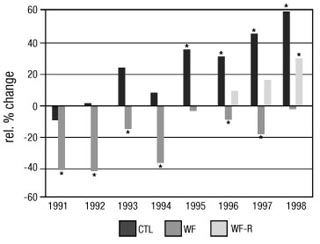
Figure 5. Percent change in perennial cover relative to baseline for re-inventoried parcels in the years and categories shown (CTL = control; WF = wellfield; WF-R = recovered wellfield, the latter category was not created until water tables returned to baseline levels beginning in 1996). Changes that are statistically significantly different from baseline, in either the positive or negative direction, are indicated by asterisks.
Recovered Wellfield – From 1991 through 1995, this group was indistinguishabe from the wellfield parcels, where perennial cover averaged below baseline level. However, with return of the water table to baseline levels and maintenance of the water table at those levels, this group (14 parcels in 1998) could be separated from the remaining wellfield parcels (Figure 5). Perennial cover in this group had risen an average of 8% above baseline cover in 1998 (Table 2). This increase in cover has not been as great as the increase measured in the control group, but nevertheless it is statistically significant. The vegetation data also show changes that have occurred in the cover of grass, shrub, and weed species since baseline years. In both control and recovered wellfield areas, shrubs have increased significantly (Table 3). This increase does not indicate a conversion of community type from meadow to scrub as of 1998, because total cover was also higher than baseline in 1998, and grasses had increased to some degree in both of these groups as well. Weed cover was also significantly greater in 1998 than baseline levels in all types of parcels. Weeds are predominantly non-native annual species, but also include some invasive perennial species. The biggest increase in weed cover was measured in the wellfield group which contained nearly 12% cover of weeds in 1998 (Table 3).
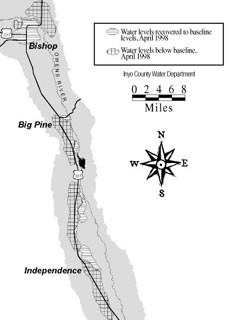
Figure 6. Wellfield areas where water tables returned to baseline levels on or before April 1998 and areas where water tables had not returned to baseline levels. All other regions are control areas, therefore not measurably affected by pumping from 1985 to 1998.
The vegetation responses tracked through the drought cycle suggest that in about one-third of the area affected by pumping, both water table and perennial plant cover returned to baseline levels by 1998 (Figure 6). Although not monitored in the past, many of these areas had been affected to some degree by pumping prior to the 1980s. The return of perennial cover and composition following water table recovery is evidence that existing vegetation at these sites is somewhat drought and pumping tolerant. It is not currently understood, however, what the effects of the recent drought cycle will be on the long-term health of the existing vegetation. Changes in shrub cover, increases in weed cover, and other factors such as the age of plants and the ability of the site to recruit new plants will influence the future of the plant communities occupying these areas.
Of greater concern are the remaining two-thirds of the areas affected by pumping where water tables have not returned to baseline levels since the drought ended (Figure 6). Unlike after previous drought cycles and unlike the recovered wellfield areas, the water tables in these areas have not returned to their previous (high) levels, so the vegetation at these sites remains subject to potentially stressful conditions. It is likely that, if another drought begins before the water table recharges soil water in the root zones of the dominant plants at these sites, the risk of permanent adverse vegetation change would increase.
In June 1998, the Inyo/Los Angeles Standing Committee asked the Inyo/Los Angeles Technical Group to recommend a program to manage pumping in a conservative manner while studies concerning groundwater management are conducted. Based on the analysis of the 1998 vegetation and groundwater data, ICWD staff offered the following interpretation of conservative pumping to the Technical Group:
- In wellfield areas where water tables and vegetation cover have returned to baseline levels, manage pumping to maintain water levels; and
- In wellfield areas where water tables and vegetation cover have not returned to baseline levels, manage pumping to promote water levels
Future Directions
To date, vegetation monitoring has provided sufficient data to allow detection of “certain described decreases or changes” in vegetation as called for in the Inyo/Los Angeles water agreement. As described in this article, the annual vegetation data collected by ICWD have proved useful in analyses of changes in perennial cover on the parcel and wellfield scale. They have also been analyzed to assess changes in plant life form, which reveal whether there have been changes in plant composition.
The data, however, could be used to investigate changes beyond those for which the monitoring program was specifically designed. Several transects are run in parcels each year and all species observed on or near the transects are recorded. All transect locations are accurately recorded using GPS (Global Positioning System). These data can be used in other analyses beyond those described in this article. For example, applying sophisticated statistical analyses to the species and cover data in conjunction with newly developed environmental data sets, such as soils data, might allow an evaluation of more subtle or gradual trends occurring in Owens Valley vegetation. Another application would be remote sensing studies. Using the accurate transect positions, vegetation information can be compared with satellite imagery or other techniques to calibrate the imagery. Once calibrated, the imagery could be used to assess vegetation conditions in areas where field data were not collected. ICWD staff are currently pursuing these two lines of inquiry.
Owens Valley Precipitation
Sally Manning, Vegetation Scientist
1998 was a wet year. ICWD staff continued to collect precipitation data at seven rain gages located in the Owens Valley during the 1998 water year (October 1997 – September 1998). Average precipitation during the period was 7.85 inches, slightly greater than the average for 1995 (Table 4). Because these are relatively new rain gage stations, it is not possible to compare the data directly to a long-term average for the sites at which they are located. At the Bishop airport (not shown in Table 4), the long-term average precipitation was 5.34 inches; the water year total for 1998 was 9.77 inches and the winter amount was 7.57.
| Rain Gage |
Precipitation (inches) |
|||||
RG-1, east of Fish Slough |
1993 | 1994 | 1995 | 1996 | 1997 | 1998 |
| 5.94 | 3.40 | 7.60 | 4.51 | 4.66 | 6.09 | |
| RG-2, near Laws | 6.29 | 3.62 | 7.80 | 4.55 | 4.91 | 7.34 |
| RG-3, southeast of Bishop | 7.21 | 4.34 | 8.87 | 4.29 | 6.85 | 9.98 |
| RG-4, south of Big Pine | 8.29 | 4.24 | 9.76 | 6.85 | 8.33 | 8.99 |
| RG-5, near Goose Lake | 6.83 | 2.15 | 7.07 | 5.64 | 7.02 | 7.47 |
| RG-6, near Blackrock | 9.00 | 2.95 | 8.67 | 7.07 | 8.68 | 10.01 |
| RG-7, east of Union Wash | 5.00 | 1.61 | 4.88 | 2.14 | 4.35 | 5.06 |
| Rain Gage Average | 6.94 | 3.19 | 7.81 | 5.01 | 6.40 | 7.85 |
| Average Precipitation Occurring Oct.1-Apr.15 (“Winter”) | 6.85 | 1.81 | 6.76 | 4.45 | 4.67 | 5.81 |
Table 4. Precipitation totals recorded at each of the county rain gages for water years 1993 through 1998. A water year runs from October 1 through September 30.
LADWP Pumping and Uses on the Bishop Cone
Randy Jackson, Inyo County Hydrologist
The Inyo/Los Angeles water agreement requires that any groundwater pumping by the Los Angeles Department of Water and Power be in strict compliance with the provisions of the “Hillside Decree,” a 1940 court settlement that precludes LADWP from exporting groundwater from an area surrounding Bishop commonly referred to as the “Bishop Cone.” To ensure that LADWP adheres to this requirement, the Inyo County Water Department and LADWP conduct an annual audit of LADWP’s groundwater extraction and water uses on Los Angeles land on the Bishop Cone. According to the agreement, in any runoff year, LADWP’s groundwater extraction may not exceed the amount of water used on its Bishop Cone lands.
The agreement defines water uses as the quantity of water supplied to Los Angeles land on the Bishop Cone, including conveyance losses (i.e. water seepage from canals and ditches), less any return flow to the Los Angeles Aqueduct system. Uses include irrigation, stockwater, and recreation. Groundwater extraction is defined as the sum of all groundwater pumped by LADWP on the Bishop Cone plus the amount of artesian water that flowed out of uncapped wells on Los Angeles land on the Cone during the runoff year.
During the 1997-1998 runoff year (the most recent year for which an audit was done), LADWP groundwater extractions consisted of 10,820 acre-feet of pumped groundwater and 4,721 acre-feet of flowing groundwater from wells adjacent to the Owens River. Uses for the same period amounted to 22,750 acre-feet.
LADWP collects the pumping and surface water information at mutually agreed upon measuring stations and provides the data to the county. ICWD performs the audit and reports on the water uses and groundwater extractions on the Bishop Cone (see “Reports and Activities” on page 21).
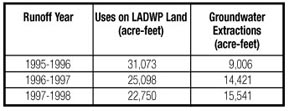
Table 5. Summary of Bishop Cone audits performed to date.
 Bishop Cone Private Well Monitoring
Randy Jackson, Inyo County Hydrologist
In the summer of 1997, the Inyo County Water Department’s hydrology staff set up a monitoring network of privately owned wells located near three proposed Los Angeles Department of Water and Power replacement wells on the Bishop Cone. The private well network, established in anticipation of the construction of the replacement wells, provided baseline information on water levels at the private wells. Monitoring continued during the summer of 1998 as one of the three replacement wells was brought into production. There was no detectable difference in water levels from pre-replacement conditions. Monitoring will continue in 1999 in the portion of the monitoring network linked to the remaining two replacement wells.
The Inyo/Los Angeles water agreement requires that LADWP groundwater pumping be managed to avoid causing significant adverse effects to water quality or water levels in privately owned wells in the Owens Valley. Any such effects must be promptly mitigated by LADWP.
Owens Valley Revegetation Program
Irene Yamashita, Revegetation Project Coordinator
The 1991 environmental impact report for groundwater management in the Owens Valley, commits Inyo County and Los Angeles to establish native vegetation on 1,300 acres at 16 sites in the valley that were affected by the citys water management between 1970 and 1990. This effort became a commitment in June 1997 when the Inyo/Los Angeles water agreement went into effect.
To get the program started, in cooperation with the Los Angeles Department of Water and Power, I developed a mitigation plan that describes each site and sets out goals, strategies, and schedules for establishing native vegetation. The first task of the plan is to protect the sites from disturbance to encourage natural revegetation. Next, revegetation methods will be tested through small-scale plantings before expanding efforts (or plantings) over the entire site.
In 1998, the Inyo County Water Department and LADWP took the initial steps set out in the mitigation plan:
The boundaries of the revegetation areas were established using a global positioning system (GPS) device. This data will be used to construct fences at the sites and to map and track progress over time. LADWP expects to have 10 of the sites fenced by the end of 1999.
Seeds from 20 Owens Valley plant species were collected the first deposit to the revegetation program’s “seed bank.” The seeds can be drawn on as needed, allowing flexibility to plan without being dependent on the erratic nature of annual seed production. In the future, the bank will be expanded to include greater species diversity and seed quantities.
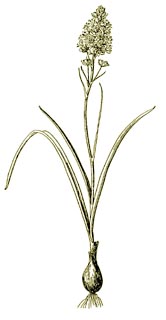
Alkali sacaton seeds were collected, and 100-150 plants will be grown out for planting in autumn 1999. The young grasses will be protected with shelters and hand irrigated for one to three years.
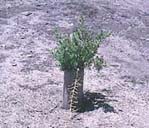
Above: Native black greasewood (Sarcobatus vermiculatus),in a plant shelter at a pilot revegetation project near Independence. Photograph by Irene Yamashita.
A cooperative study was developed to test planting techniques and potential irrigation systems at two revegetation sites, one east of Big Pine and the other south of Independence. A consultant will be retained to conduct the tests.
In addition, monitoring of existing pilot revegetation projects continued in 1998:
1991 and 1996 plantings near Laws were monitored for survival. The 1991 study of fourwing saltbush is now focusing on long-term survival; data will be evaluated after the 2001 growing season. The 1996 planting was intended to increase the species diversity at the site. After two years, the survival rate of this planting is 53%. Six shrub species and two grass species appear to be promising candidates for future revegetation at this site.
A 1996 test planting near Independence was also intended to examine potential plant species for the area, in addition to testing a planting pattern that could encourage natural recruitment. Thus far, seven shrub species and one grass species appear to be surviving. Plants that have been on the site for two years have a 36% survival rate. In early 1996, ICWD staff planted cottonwoods, red willow, and birch along a disturbed section of McGee Creek that runs through Millpond Recreation Area. These trees were planted as cuttings, were protected with tree shelters, and have been monitored annually. This minimal input planting technique has had promising results. After two growing seasons, 76% of the cottonwoods and 54% of the willows have survived.
Saltcedar Control Program
Brian Cashore, Saltcedar Control Project Coordinator
When tamarisk or saltcedar was intentionally introduced into the U.S. in the early 1900s it was merely one of many non-native ornamental nursery plants that were transplanted around the globe. What makes non-native invasive plants such as saltcedar different from other introduced species is their ability to take advantage of disturbances to the native plant community to expand their limits. Once established, non-native invasive plants can spread rapidly because of the lack of natural enemies that keep plant populations balanced in their native range. Even though plants, animals, and other natural organisms continually change and expand their territories, the pace of the changes caused by human disturbance is unprecedented.
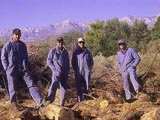
Above: 1998 saltcedar control team members, Bryan Taylor,
Chuck Spresser, Bruce Klein, and Rick Puskar.
Photograph by Brian Cashore.
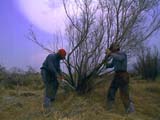
Left: Brian Cashore and Rick Puskar tackle Owens Valley’s saltcedar.
Photograph by Steve Ingram.
In the Western U.S., disturbance came in the form of an increasing human population and the water diversions, manipulations, and dam building that resulted. In the Owens Valley, much of the valley floor was disturbed when the Los Angeles Department of Water and Power constructed a series of dikes and basins to contain the abnormally high runoff in the late 1960s. Before that, saltcedar was only a minor component of the valley’s plant composition. In 1998, the Inyo County Water Department increased its efforts to curb the spread of saltcedar by hiring a seasonal saltcedar eradication crew and setting up a program of systematic tamarisk control. Three seasonals, Bruce Klein, Chuck Spresser and Bryan Taylor joined Rick Puskar and myself in the effort to contain and control the spread of saltcedar while working towards the denser populations in the central portion of the valley. Though labor intensive, the technique of manually cutting the trees with chainsaws and loppers and immediately treating only the cut stumps with an environmentally safe herbicide is highly effective and less destructive to the landscape than some other forms of invasive plant control. Eventually, other techniques such as controlled burning and biocontrol using insects will be incorporated into the program. At each work site, a data sheet is filled out and the location is recorded using a global positioning system (GPS) so that future monitoring and follow-up treatment can be undertaken.
The saltcedar crew worked on sites from north of Bishop to south of Independence cutting plants ranging in size from 1/4 inch to 18 inches in diameter. Much of the work along the Owens River involved crew members walking along the river banks with chainsaws cutting and treating trees, then meeting our truck at an accessible road downstream. At one irrigated site, the crew worked for 9 days cutting an area of less than 3 acres that produced over 35 cords of cut tamarisk wood, 3 cow carcasses, and countless rat nests. It took a 15-man CDF crew over two weeks to clear and burn the slash at this location.
Because the core area of saltcedar is located within the lower Owens River area, approximately $1 million of a $3 million grant to rewater the river has been allocated specifically for the saltcedar control program. The expanded crew and program will make it possible to increase control efforts prior to the rewatering associated with the Lower Owens River Project.
The end of the 98/99 field season culminated with the taking of Black Rock Springs Hill along the dry river channel near Black Rock Fish Hatchery. Looking north from this vantage point, we saw the dry Owens River bed free of saltcedar trees, ready for the Lower Owens River Project water releases. Looking south, we saw the red bark-tinged hue of a saltcedar-covered landscape, and next season’s work.
Report on the Memorandum of Understanding
Leah Kirk, Environmental Project Coordinator
In the summer of 1997, a Memorandum of Understanding was struck between the California Department of Fish and Game, the State Lands Commission, the Sierra Club, the Owens Valley Committee, the Los Angeles Department of Water and Power, and Inyo County. The MOU resolved the concerns of the organizations and state agencies over the Lower Owens River Project and other provisions of the 1991 environmental impact report for groundwater management in the Owens Valley.
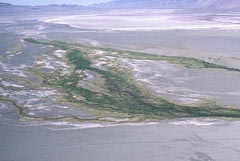
The Owens River Delta. Photograph by Brian Tillemans/LADWP
The MOU requires LADWP and Inyo County to implement numerous environmental projects and studies. Here is a summary of MOU projects and accomplishments since the MOU went into effect.
Lower Owens River Project: This project is a provision of the Inyo/Los Angeles water agreement; it was later identified in the EIR as compensatory mitigation for impacts that occurred between 1970 and 1990. The MOU augments the agreement and the EIR. The LORP consists of:
The Lower Owens River.A 60-mile stretch of the river channel will be rewatered, beginning at the point where the river is diverted to the Los Angeles Aqueduct and ending at Owens Lake. Flows in the river will be approximately 40 cubic feet per second (cfs). In average and above average runoff years, there will be “seasonal habitat flows” of 200 cfs, with lesser flows in drier years.
The Owens River Delta Habitat Area.Some 325 acres of wetlands at the north end of Owens Lake will receive 6-9 cfs annually to provide habitat for shorebirds, waterfowl, and other animals. Off-River Lakes and Ponds. Existing off-river lakes and ponds in the LORP area will be maintained for fisheries, waterfowl, shorebirds, and other animals.
The 1,500-Acre Blackrock Waterfowl Habitat Area. In average and above runoff years, approximately 500 acres within an overall project area of 1,500 acres will be flooded to provide habitat for resident and migratory waterfowl and other native species. In drier years, a smaller area will be flooded.
Status: The U.S. Bureau of Reclamation has prepared the preliminary design for a pump system to be located near Owens Lake to carry water from the river to the Los Angeles Aqueduct or to Owens Lake for dust abatement. Final designs and plans for the pump system are expected to be completed in early 2000. Ecosystem Sciences, Inc. has prepared management recommendations for the project. Inyo County retained a consultant to assist in complying with environmental laws applicable to the project. A draft EIR for the project should be completed in late 1999 or early 2000.
To date, the county has obtained $3.55 million from the federal government to offset the costs of implementing the project. The county and Los Angeles are each seeking additional federal funds for the project. Flows in the river are planned to begin by 2001.
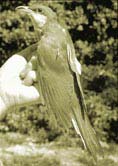
Yellow-Billed Cuckoo Habitat Evaluation:
Under the direction of LADWP and the county, ESI will evaluate Yellow-billed Cuckoo habitat in woodland areas of Hogback and Baker creeks. ESI will develop habitat enhancement plans for these areas in consultation with LADWP, the lessees for the areas, and the parties to the MOU. The evaluations will be completed by June 2000. Habitat enhancement plans will be implemented as expeditiously as possible.
Status: ESI is preparing draft habitat enhancement plans, which should be completed by the end of 1999.
Western Yellow-billed Cuckoo. Photo by J.A. Spendelow
Inventories of Plants and Animals at Springs and Seeps: By June 2000, LADWP and the county must complete an inventory of plants and animals at springs and seeps on Los Angeles land in the Owens Valley.
Status: ESI conducted the bulk of the inventory in the LORP area during the summer of 1998. They will complete the inventory in the northern portion of the Owens Valley in 1999.
Additional Mitigation: Under the direction of LADWP and the county, ESI will recommend on-site and/or off-site mitigation measures, including mitigation at Hines Spring, to supplement mitigation measures identified in the EIR for impacts to Owens Valley springs. LADWP is to provide 1,600 acre-feet of water per year to supply the recommended measures. The mitigation measures will be implemented by LADWP and maintained by LADWP and/or the county. The measures must be in place by June 2000.
Status: ESI has initiated its evaluation of potential mitigation sites.