Water Department
ICWD Home > Research and Reports > Annual Reports >
Table of Contents
Cover Page
Director's Report
Staff
Budget
Saltcedar Report
Precipitation
Mitigation
Vegetation
Soil Water Conditions
Groundwater Conditions
LORP Hydrology
Pumping History
Pumping 2008-2009
Bishop Cone Audit
Pumping Management and Groundwater Conditions
Inyo County and the Los Angeles Department of Water and Power (LADWP) entered into an Interim Management Plan (IMP) for groundwater management within the framework of the Water Agreement during the three runoff-years beginning in Runoff-year 2007-08. The IMP was implemented to provide an environment conducive to progress on the Green Book Revision Cooperative Study. Documents concerning the IMP can be found here.
 The IMP will terminate on March 31, 2010. Groundwater pumping in the
Owens Valley under the IMP is managed with the goal of having average
forecasted wellfield groundwater levels on April 1, 2010 (wellfield target
levels) at or greater than the average measured wellfield groundwater levels
on April 1, 2007, subject to criteria described in the IMP. The Lone
Pine and Bishop Wellfields are exempted from this groundwater level
provision. The Bishop Wellfield will be managed in accordance will the
Hillside Decree, the Water Agreement and applicable court rulings.
Lone Pine pumping will be limited to supplying the town water system and
Enhancement/Mitigation project irrigation and possibly an operational test
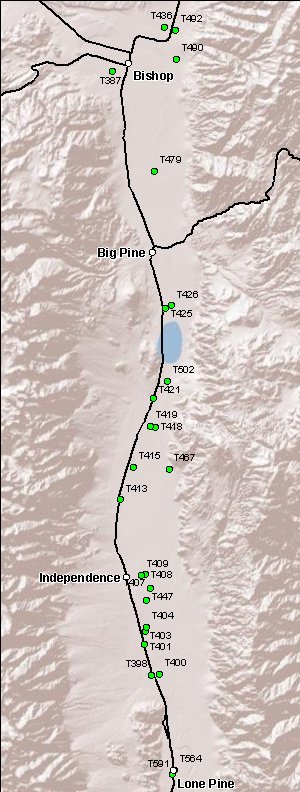
of a new well, W416. April groundwater levels are forecasted using the IMP
monitoring wells (see map at right) shown in Table 1 and
their associated regression models contained in the documentation in the
link provided above. A list of exempt pump-equipped wells is also provided
in the IMP documentation. These wells are exempt from the water level
provisions of the IMP. The list has been amended several times
to allow for all known and necessary sole-source pumping needs.
In summary, the IMP provides for specific sole-source uses in Owens Valley
and curtails export pumping if it causes groundwater levels to decline below
April 2007 levels.
The IMP will terminate on March 31, 2010. Groundwater pumping in the
Owens Valley under the IMP is managed with the goal of having average
forecasted wellfield groundwater levels on April 1, 2010 (wellfield target
levels) at or greater than the average measured wellfield groundwater levels
on April 1, 2007, subject to criteria described in the IMP. The Lone
Pine and Bishop Wellfields are exempted from this groundwater level
provision. The Bishop Wellfield will be managed in accordance will the
Hillside Decree, the Water Agreement and applicable court rulings.
Lone Pine pumping will be limited to supplying the town water system and
Enhancement/Mitigation project irrigation and possibly an operational test
of a new well, W416. April groundwater levels are forecasted using the IMP
monitoring wells (see map at right) shown in Table 1 and
their associated regression models contained in the documentation in the
link provided above. A list of exempt pump-equipped wells is also provided
in the IMP documentation. These wells are exempt from the water level
provisions of the IMP. The list has been amended several times
to allow for all known and necessary sole-source pumping needs.
In summary, the IMP provides for specific sole-source uses in Owens Valley
and curtails export pumping if it causes groundwater levels to decline below
April 2007 levels.
Runoff during the 2008-2009 runoff-year (April through March) was below normal. This was the second consecutive year with below normal runoff predicted for the Owens Valley. Runoff during the 2008-2009 runoff-year was forecasted at 86% of normal. In the runoff-year 2008-2009, 68,149 acre-feet of groundwater was pumped from LADWP wells in the Owens Valley. Table 2 shows pumping for the runoff-year 2008-2009 by wellfield within the Owens Valley. This was above the 66,800 planned under the IMP for the 2008-2009 runoff-year by 1,349 acre-feet. Modest pumping under the IMP and below normal runoff combined to produce a relatively stable shallow water table with small increases and decreases in the water table in the 20 IMP indicator test holes and other indicator test holes (See Table 1). The Laws Wellfield was the one wellfield exception. In 2005 and 2006, court mandated water spreading developed relatively high water tables (mounding) in Laws and in subsequent years water tables have declined due to natural mound decay, evapotranspiration and pumping for irrigation and stockwater uses in the Laws Wellfield (See Table 1).
Water levels generally remain below the levels of the mid-1980’s baseline vegetation mapping period (See Table 1, last column). Of the 36 test holes in Table 1, three were above the baseline in April 2009.
The groundwater recharge estimation methods used for the groundwater mining calculations mandated by the Green Book show approximately 129,000 acre-feet of recharge for the 2008 water-year (October through September) for the Owens Valley. In contrast, pumping for the 2008 water-year was 65,232 acre-feet (LADWP’s Table 4, 2009-10 operations plan).
Table 1. Depth to water (DTW) from Shallow Test Hole Reference Point (R.P.) at Indicator Wells, April 1, 2009. All Data are in Feet. Baseline is the Average of 1985, 1986, and 1987 April DTW (given available data). Negative change from April 2007 indicates a declining water table; negative deviation from baseline Indicates the Water Table is below baseline. (IMP Test Hole Numbers in Bold).
| Wellfield and Shallow Test Hole Number |
DTW April 2009 |
DTW April 2008 |
DTW April 2007 |
Change from April 2007 to April 2009 |
Baseline DTW from R.P. |
Deviation,
Baseline to April 2009 |
| Bairs-Georges | ||||||
| T398 | 4.87 | 5.38 | 4.31 | -0.56 | 6.34 | 1.47 |
| T399* | ND | 3.52 | 2.97 | ND | 2.96 | ND |
| T400 | 6.31 | 6.02 | 5.77 | -0.54 | 6.32 | 0.01 |
| Symmes-Shepherd | ||||||
| T401* | ND | 21.71 | 23.21 | ND | 17.87 | ND |
| T402 | 11.08 | 11 | 10.82 | -0.26 | 8.03 | -3.05 |
| T510 | 7.45 | 7.29 | 7.44 | -0.01 | 4.98 | -2.47 |
| T403 | 6.8 | 6.84 | 7.57 | 0.77 | 5.32 | -1.48 |
| T404 | 5.81 | 5.75 | 5.81 | 0 | 3.55 | -2.26 |
| T511 | 7.93 | 7.9 | 8.01 | 0.08 | 4.6 | -3.33 |
| T447 | 34.3 | 35.03 | 36.23 | 1.93 | 22.2 | -12.1 |
| Independence-Oak | ||||||
| T407 | 10.59 | 10.81 | 11.05 | 0.46 | 7.57 | -3.02 |
| T406 | 4.18 | 3.63 | 3.93 | -0.25 | 1.53 | -2.65 |
| T408 | 4.36 | 4.17 | 4.31 | -0.05 | 3.13 | -1.23 |
| T409 | 4.01 | 4.38 | 4.53 | 0.52 | 2.12 | -1.89 |
| T546 | 7.55 | 6.78 | 6.48 | -1.07 | 3.6 | -3.95 |
| T412 | 8.6 | 7.72 | 7.24 | -1.36 | 4.29 | -4.31 |
| T453 | 12.58 | 11.11 | 4.43 | -8.15 | 5.52 | -7.06 |
| Thibaut-Sawmill | ||||||
| T413 | 13.17 | 12.78 | 11.33 | -1.84 | 9.34 | -3.83 |
| T414 | 11.44 | 10.65 | 8.92 | -2.52 | 6.95 | -4.49 |
| T415 | 22.67 | 19.57 | 19.94 | -2.73 | 18.54 | -4.13 |
| T507 | 6.9 | 6.24 | 6.56 | -0.34 | 4.62 | -2.28 |
| Taboose-Aberdeen | ||||||
| T417 | 32.76 | 29.99 | 30.81 | -1.95 | 26.92 | -5.84 |
| T418 | 9.35 | 8.95 | 9.72 | 0.37 | 8.18 | -1.17 |
| T419 | 7.71 | 6.51 | 7.7 | -0.01 | 6.55 | -1.16 |
| T421 | 34.49 | 33.63 | 34.18 | -0.31 | 34.31 | -0.18 |
| T502 | 9.51 | 8.14 | 8.73 | -0.78 | 7.49 | -2.02 |
| T504 | 10.8 | 9.74 | 10.53 | -0.27 | 10.78 | -0.02 |
| T505 | 24.24 | 21.68 | 22.47 | -1.77 | 18.6 | -5.64 |
| Big Pine | ||||||
| T425 | 16.23 | 15.9 | 15.87 | -0.36 | 14.89 | -1.34 |
| T426 | 13.35 | 13.15 | 13.01 | -0.34 | 11.57 | -1.78 |
| T469 | 23.22 | 22.91 | 22.18 | -1.04 | 21.73 | -1.49 |
| Laws | ||||||
| T107 | 28.85 | 26 | 21.98 | -6.87 | 24 | -4.85 |
| T436 | 9.98 | 8.23 | 6.45 | -3.53 | 8.4 | -1.58 |
| T438 | 12.32 | 11.42 | 9.49 | -2.83 | 9.61 | -2.71 |
| T490 | 15.38 | 14.14 | 11.8 | -3.58 | 13.03 | -2.35 |
| T492 | 30.78 | 28.41 | 24.69 | -6.09 | 32.83 | 2.05 |
| T883 | 23.85 | 20.5 | 14.9 | -8.95 | ND | ND |
Table 2. LADWP pumping by wellfield in Acre-Feet for 2008-2009 (actual) and 2009-2010 (planned).
| Wellfield Pumping Acre-Feet | Pumping 2008-2009 | Planned Pumping 2009-2010 |
| Lone Pine | 676 | 1,200 |
| Bairs-Georges | 150 | 400 |
| Symmes-Shepherd | 1,230 | 1,200 |
| Independence-Oak | 7,003 | 7,400 |
| Thibaut-Sawmill | 12,126 | 12,800 |
| Taboose-Aberdeen | 7,108 | 550 |
| Big Pine | 21,073 | 21,000 |
| Bishop | 10,900 | 11,000 |
| Laws | 7,883 | 7,900 |
| Total | 68,149 | 63,450 |
Review of Conditions by Area
Laws Wellfield
In the Laws Wellfield, located north and east of Bishop, the water table responds dramatically to pumping and recharge (e.g. hydrograph for T492 in Figure 1. Shallow water table hydrographs for test holes T107, T436, T438 T490 and T492 are shown in Figure 1. Pumping in the 2008-2009 runoff-year was 7,883 acre-feet, all of which was used in the Laws area. No water was diverted from the Owens River into the McNally Canals. Groundwater levels declined to below April 2007 levels and four test holes are below baseline water levels (See Table 1). Declines were due to the mound decay from previous court mandated recharge, pumping for uses in the wellfield and evapotranspiration from vegetation. Wellfield pumping history.
Bishop Cone Wellfield
Pumping on the Bishop Cone was 10,900 acre-feet for the 2008-2009 runoff-year. Shallow water table hydrographs for test holes T387 and T479 are shown in Figure 2. Generally, pumping from wells on the Bishop Cone and recharge from the extensive network of canals, ditches and creeks balance to produce stable water levels. The Bishop Cone Wellfield is not managed by the groundwater level provisions of the IMP, rather, it is managed consistent with the Hillside Decree, the Water Agreement and applicable court rulings. The Bishop Cone Audit for the 2007-2008 runoff-year indicates that total groundwater extraction did not exceed water usage on Los Angeles-owned land on the Bishop Cone. Wellfield pumping history. The Bishop Cone Audit for the 2008-2009 runoff year is in process at the Inyo County Water Department and is expected to be finalized by the end of the 2009 calendar year.
The Big Pine Wellfield
Pumping in the Big Pine Wellfield for the 2008-2009 runoff-year was 21,073 acre-feet. Pumping has been historically relatively high compared to other wellfields to supply the CDFG Fish Springs Fish Hatchery. Shallow water table hydrographs for test holes T425, T426 and T469 are shown in Figure 3. Groundwater levels in April 2009 were slightly below April 2007 levels in Table 1. In all three test holes in Table 1, shallow groundwater water levels remain a foot or more below baseline levels. Wellfield pumping history.
The Taboose-Aberdeen Wellfield
Pumping in the Taboose-Aberdeen Wellfield for the 2008-2009 runoff-year was 7,108 acre-feet. Shallow water table hydrographs for test holes T417, T418, T419, T421, T502, T504 and T505 are shown in Figure 4. Groundwater levels in April 2009 were below April 2007 water levels in Table 1. In all of the seven test holes in Table 1, groundwater levels are below baseline levels. In the past this wellfield has undergone large pumping induced fluctuations. Wellfield pumping history.
The Thibaut-Sawmill Wellfield
Pumping in the Thibaut-Sawmill Wellfield for the 2008-2009 runoff-year was 12,126 acre-feet. Historically pumping has been approximately this amount or higher for the Blackrock Fish Hatchery of the California Department of Fish and Game. Shallow water table hydrographs for test holes T413, T414, T415 and T507 are shown in Figure 5. Groundwater levels in April 2009 were all below April 2007 levels in test holes in this wellfield (See Table 1). In all indicator test holes in the Thibaut-Sawmill Wellfield water levels remain below the baseline levels (See Table 1). In the past this wellfield has undergone large pumping-induced fluctuations. Wellfield pumping history.
The Independence-Oak Wellfield
Pumping in the Independence-Oak Wellfield for the 2008-2009 runoff-year was 7,003 acre-feet. Shallow water table hydrographs for test holes T407, T406, T408, T409, T546, T412 and T453 are shown in Figures 6a and 6b. Groundwater levels in two of the seven test holes in April 2009 were above April 2007 levels (See Table 1). In all of the seven indicator test holes in the Independence-Oak Wellfield water levels remain below the baseline levels (See Table 1). In the past this wellfield has experienced sustained pumping due to the large number of exempt wells. Wellfield pumping history.
The Symmes-Shepherd Wellfield
Pumping in the Symmes-Shepherd Wellfield for the 2008-2009 runoff-year was 1,230 acre-feet. Shallow water table hydrographs for test holes T401, T402, T403, T404, T510, T447 and T511 are shown in Figures 7a and 7b. Groundwater levels in four of the six remaining test holes in April 2009 were above April 2007 levels (See Table 1). In all of the seven indicator test holes in the Symmes-Shepherd Wellfield water levels remain below the baseline levels (See Table 1). Historically, pumping has varied greatly from this wellfield. Note that test hole T401 has been destroyed by road construction. Wellfield pumping history.
The Bairs-Georges Wellfield
Pumping in the Bairs-Georges Wellfield for the 2008-2009 runoff-year was 150 acre-feet. Shallow water table hydrographs for test holes T398, T399 and T400 are shown in Figure 8. Groundwater levels in all two of the remaining indicator test holes in April 2009 were slightly below April 2007 levels (See Table 1). In two of the remianing indicator test holes in the Bairs-Georges Wellfield water levels remain above the baseline levels (See Table 1). Historically, pumping has varied greatly from this wellfield. Note that test hole T399 has been destroyed by road construction. Wellfield pumping history.
The Lone Pine Wellfield
Pumping in the Lone Pine Wellfield for the 2008-2009 runoff-year was 676 acre-feet. Shallow water table hydrographs for test holes T564 and T591 are shown in Figure 9 for reference. There are no indicator test holes in this wellfield. Pumping in this wellfield has been principally for town supply, Diaz Lake and an Enhancement /Mitigation irrigation project east of the town. LADWP has constructed a new production well west of the town of Lone Pine to supply the Los Angeles Aqueduct (W416). LADWP and ICWD are currently developing a process and plan for testing this well and implementing management to protect groundwater dependent natural resources and private wells. Wellfield pumping history.
Projections Concerning the 2009-2010 Runoff-year
The April 1, 2009 LADWP Runoff Forecast for the 2009-2010 Runoff-year was 71% of normal. Another dry year, the third in a row. Using the IMP regression equations and the planned pumping in the LADWP 2009-2010 Owens Valley Operations Plan (Table 2), projections concerning April 2010 water levels in the 20 IMP Indicator wells have been made by ICWD and LADWP Staff. Those projections by ICWD are shown in Table 3.
Table 3. Projected change in cepth to water from April 2007 to April 2010.
| Wellfield | Indicator Test Hole | April 2010 DTW change from April 2007 in Feet |
| Laws | T436 | -5 |
| T490 | -4.8 | |
| T492 | -11.2 | |
| Average | -7 | |
| Big Pine | T425 | -1.6 |
| T426 | -1.1 | |
| Average | -1.4 | |
| Taboose-Aberdeen | T418 | 0.9 |
| T419 | 1.1 | |
| T421 | -0.3 | |
| T502 | -1.6 | |
| Average | 0.1 | |
| Thibaut-Sawmill | T413 | -3 |
| T415 | -2.3 | |
| Average | -2.6 | |
| Independence-Oak | T407 | 0 |
| T408 | -0.3 | |
| T409 | -2.2 | |
| Average | -0.8 | |
| Symmes-Shepherd | T401 | ND |
| T403 | 1.1 | |
| T404 | 0.3 | |
| T447 | 2.1 | |
| Average | 1.2 | |
| Bairs-Georges | T398 | -1 |
| T400 | -0.4 | |
| Average | -0.7 |