Water Department
The Owens Valley Monitor 1999-2000
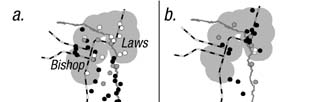

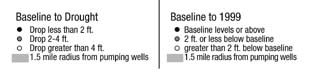
Figure 2. a) white, gray, and black circles represent
monitoring wells with groundwater declines from baseline
to 1992 of greater than four feet, from two to four feet,
and less than two feet respectively; and b) white, gray,
and black circles represent the deviation below baseline
water levels, as of April 1999, of greater than two feet,
two feet or less, and at or above baseline respectively.
Groundwater Conditions
When LADWP inventoried Owens Valley vegetation between 1984 and 1987, water tables were generally high throughout the valley because of a series of wet years (1982-86) and relatively low groundwater pumping. The vegetation mapped during that period, which became the baseline for management under the Inyo/Los Angeles Water Agreement, reflected these conditions.
Following the inventory, during the first three years of the six-year drought, LADWP pumped approximately 210,000 acre-feet (1987), 200,000 acre-feet (1988), and 155,000 acre-feet (1989). Water tables declined in most wellfields to substantially below the plant root zones, and as a result, the vegetation declined.
In 1990, in recognition of the decline in water tables and vegetation and the experimental nature of the management techniques of the Water Agreement, the Inyo/Los Angeles Standing Committee adopted the "Drought Recovery Policy." The policy required that groundwater pumping be managed in a conservative manner to allow substantial recovery of water tables, soil moisture, and vegetation. Since then, LADWP's pumping has been lower than the pumping of the late 1980s (see Figure 1). In response to both lower pumping and several high runoff years, water tables rose during the 1990s.
Figure 2a shows the magnitude of drawdown that occurred at 192 shallow monitoring wells between the baseline period for hydrology (1985 to 1987) and 1992, the last of six consecutive dry years. Figure 2b shows the difference between baseline water levels and April 1999 levels at 176 monitoring wells. The circles in this figure are shaded according to different criteria to show how close the test wells are to baseline levels. Baseline groundwater levels are the average April water levels from 1985 to 1987. The gray background shows the area within 1.5 miles of LADWP pumping wells.
Areas of greatest water table decline in Figure 2a (white circles) coincide with the locations of highest groundwater extraction. In Figure 2b, many of the monitoring wells that are the furthest from recovery to baseline (white circles) are also near areas where the greatest amount of pumping has occurred. Comparison of Figures 2a and 2b shows that some monitoring wells have recovered in response to the high recharge and pumping managed under the Drought Recovery Policy; however, many wells remain below baseline levels (white circles).
In the Laws area, north of Bishop, water tables were drawn down well below four feet between the baseline period and 1992 (Figure 2a). However, in 1999, several monitoring wells in the area were at baseline or above (Figure 2b). These high water table levels were the result of recharge induced by LADWP's operation of the McNally canals and water spreading in the Laws area during the summer of 1998. Water levels in some monitoring wells rose over 10 feet in that year. Water levels in the Laws area declined in 1999 in response to pumping and low recharge.
Return to the Table of Contents
![]()